A PERT diagram consists of tasks and dependencies. Tasks are drawn as the nodes of the graph; dependencies are drawn as the edges of the graph.
Launch JHotDraw PERT: ![]()
Figure 1: Screenshot of the PERT application. Click image for larger view.
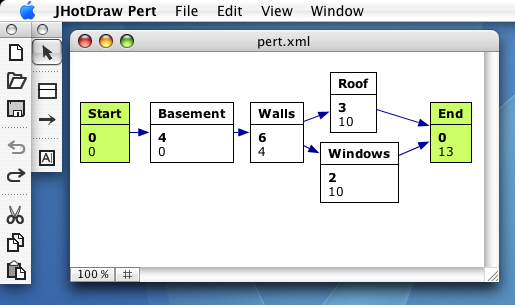
Each task figure has a name field, a duration field and a start time field. One can enter the values for the name field and the duration field. Specifying a duration of 0 denotes a milestone task. Milestones usually have names like 'Start' or 'End'. The value of the start time field can not be entered – is computed dynamically by the Figure objects.
Each node figure has an arrow at one end. The arrow points to the dependent task.
The figures are 'aware' of their semantics. Connecting a task figure with another task figure establishes a dependency between the two figure objects. Causing all dependent task figure to update their duration fields. Also, the figures prevent the creation of cycles in the graph, by only offering connectors on figures when this does not cause a cycle in the graph.